Environment

Two millenia of data points to human-induced climate change

Two millenia of data points to human-induced climate change
One of the most comprehensive climate databases has revealed clear evidence of human-induced climate change
View 2 Images
This graph shows a long-term global cooling period interrupted by a sudden uptick in temperature (which scientists call the "hockey stick") around the time of the Industrial Revolution
1/2
This graph shows a long-term global cooling period interrupted by a sudden uptick in temperature (which scientists call the "hockey stick") around the time of the Industrial Revolution
One of the most comprehensive climate databases has revealed clear evidence of human-induced climate change
2/2
One of the most comprehensive climate databases has revealed clear evidence of human-induced climate change

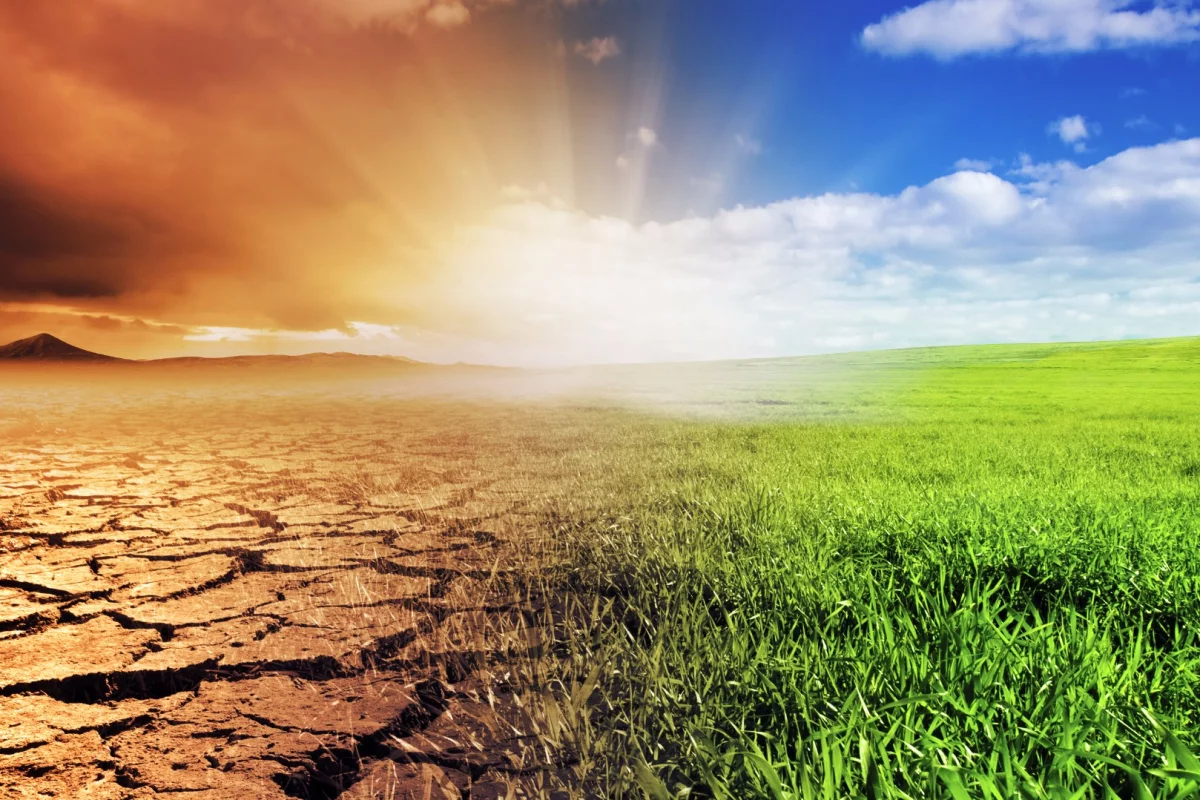
With 2016 claiming the title of hottest year on record, models, statistics and timelapse photos are painting a pretty clear picture of who's to blame. Now scientists have updated one of the most comprehensive databases of the planet's temperature changes over time, taking into account records from a variety of sources and stretching back to the year 1 CE – and it's very damning evidence of human-induced climate change.

The Past Global Changes (PAGES) project was launched in 1991 as a way to study the planet's climatic past to help understand its present and future. In 2013, the PAGES 2k Consortium released an open-source database made up of 501 records, gathered and overseen by 98 scientists from 22 countries. Since then, the number of records has grown to more than 690.

These records come from a variety of sources, including tree ring measurements, corals, glacier ice, lake and seafloor sediment, mineral formations in caves, and even historical documents. While each of these might not be all that reliable on their own, cross-checking them against each other has shown they're all telling a very consistent tale, helping scientists build a detailed picture of the climate over the past 2,000 years.

This graph shows a long-term global cooling period interrupted by a sudden uptick in temperature (which scientists call the "hockey stick") around the time of the Industrial Revolution
This graph shows a long-term global cooling period interrupted by a sudden uptick in temperature (which scientists call the "hockey stick") around the time of the Industrial Revolution

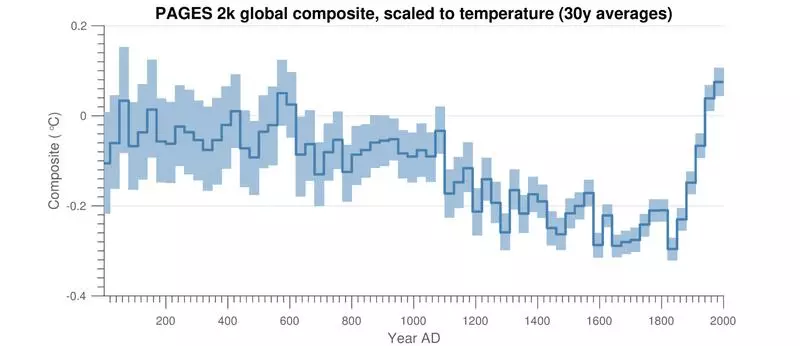
That story is a grim one. The researchers found that until the middle of the 19th century, the Earth was going through a long-term cooling trend, but since 1880 the average global temperature has risen about 0.8° C (1.8° F). That uptick is so striking on a graph that scientists dubbed it the "hockey stick," and it's no coincidence that it began right around the time of the Industrial Revolution.

"It adds weight to the idea that the current rate of warming is unprecedented in the past 2,000 years, and, together with many other sources of evidence, further indicative of a human influence on climate," says Julien Emile-Geay, one of the scientists on the project. "It comes down to this: We know the human burning of fossil fuel is very rapidly warming the planet, and we know that the longer we wait, the harsher the consequences and the more costly it is to prevent them. What is the point of endlessly delaying action?"

The study was published in the journal Scientific Data.

Source: University of Southern California, PAGES

29 comments
29 comments
ThomasEdwardMiller
About 93% of the energy gained by Earth is going into the oceans. We therefore need to address this problem. The ocean has a very high solar absorptivity with the sun overhead, meaning it absorbs practically all the energy from the sun if solar elevation angles are reasonably high (angle between sun rays and horizontal ocean is greater than 45 deg or so). Since mists and clouds also absorb solar energy well we could create mists over the ocean with floating spray pumps operated by wave motion. The solar energy will be absorbed by the mists and clouds will form more easily because of increased humidity from evaporation. If the evaporation is done near cities, people could heat the moist air blowing onto land with sea breezes by means of solar air heaters. Mist cooling systems are used a lot in drier areas, so floating mist generators is not entirely new technology. Roofs are already being cooled by convection so solar air heaters on roofs is not entirely new technology. Clouds generally have a cooling effect on Earth. The suggestion above will bring rain to cities.
over_there
THE GRAPH SAYS ITS NOW 0.02 DEGREES WARMER THAN IT WAS IN YEAR 600. Its not really worth saying any more. Is this really a test to see if people can read graphs ?
eric.verhulst@altreonic.com
"unprecedented in the past 2,000 years"? The graph clearly shows the same temperature for the first 1000 years as we have now, followed by a cooling (did the CO2 level drop ?) with again a warming up in the last 200 years. So, what does the graph demonstrate?
mark34
137 years (1880 to present) times 0.8 deg C (1.8 deg F) per year increase multiplies out to an increase of 109 C or 247 F....asbestos underwear anyone?
Nik
The ''Little Ice Age'' was also unprecedented, who shall we blame for that? That was hardly a 'warming' during the last 2000 years! When the earth exits an Ice age, it get warmer, until it gets colder again. These 'scientists' are really struggling to earn their crusts from the tax pot.
Pilate
A lie repeated long enough ....
iplasticpi
As Mark34 says, the commentary doesn't match the graph. 0.8 deg C per year? The graph clearly shows < 0.4 deg C for the Century. And they only show temperatures for the past 2000 years - going back 20,000 years it was 8 deg C colder. Definitely man caused.
Koolski
In a new peer-reviewed study entitled, “On the Validity of NOAA, NASA and Hadley CRU Global Average Surface Temperature Data and the Validity of EPA’s CO2 Endangerment Finding” finds that “nearly all” temperature datasets have been manipulated. These datasets attempt to account for high temperatures in urban areas (where many of the readings are taken) and the like. The relevant part of the study is that all the "global warming" occurs within these adjustments. The study reveals that these highly respected and infallible governmental scientists, of which we are not allowed to ever question, have “adjusted” the raw data to “cool past temperatures and warm more current records, increasing the warming trend.”
So people who believe in warming are manipulating the data to confirm their belief in global warming. I'm so tired of this.
thurstjo63
LOL! There is data on carbon dioxide going back 570 million years! And you take a little slice from the 2000 to supposedly prove a point!?! And what a point it is. The carbon dioxide which is absolutely essential in photosynthesis in plant life and is involved in every medical compound created by plants is a pollutant!?! The stupidity is breathtaking. If one looks at the ALL the data, it's clear that we are at one of the lowest points in earth's history in the quantity of CO2 in the atmosphere and the really amazing point is that it has little to no correlation with the temperature. Here's the research to prove it. http://earth.geology.yale.edu/~ajs/2001/Feb/qn020100182.pdf
https://vimeo.com/216620844
watersworm
And...what a surprise, 1880 is considered the first year with enough thermometers around the world (though very few in Africain Asia South America Antartica and 71% Earth surface aka Oceans !!!)
Load More