


A new paper has revealed that Greenland and the Antarctic have lost a staggering amount of mass from their ice sheets over the last 16 years thanks to climate change, and that the melting has contributed to sea level rise. The researchers drew on satellite measurements that were taken by bouncing masses of laser bursts off the Earth’s surface.
Since its launch in 2018 atop a ULA Delta II rocket, NASA’s Ice, Cloud and Land Elevation Satellite (ICESat-2) has been tirelessly at work taking measurements of our changing planet. The cutting-edge spacecraft carries with it a single scientific instrument – the Advanced Topographic Laser Altimeter System, also known as ATLAS.
ATLAS is capable of firing off 10,000 laser pulses each second, which bounce off the Earth below and are then collected by ICESat-2’s receiver telescope. By recording the amount of time it takes for photons to return to the spacecraft, and referencing this data with the probe’s exact orbital position, NASA is able to calculate the height of Earth’s landscape with phenomenal accuracy.
For the new study, researchers used data from the ICESat-2 mission, and combined it with that of its predecessor ICEsat – which was active between 2003 and 2009 – in order to accurately determine how the colossal ice sheets and shelves of the Antarctic and Greenland have changed over time.
"If you watch a glacier or ice sheet for a month, or a year, you're not going to learn much about what the climate is doing to it," said lead author Benjamin Smith, a glaciologist at the University of Washington. "We now have a 16-year span between ICESat and ICESat-2 and can be much more confident that the changes we're seeing in the ice have to do with the long-term changes in the climate.”
The team took topographical data from ICESat detailing the height of ice sheets and shelves, and overlaid observations made in 2018/19 by ICESat 2. Where the datasets intersected, the team was able to calculate how much ice was lost or gained, while accounting for factors such as snow density.
The satellite observations revealed a notable thinning of the coastal glaciers in Greenland, which in places lost 14 to 20 ft (4 to 6 m) of height each year. Rising summer temperatures were found to have melted a huge quantity of ice from the sheets, while warmer oceans eroded the sea-ice front in some areas.
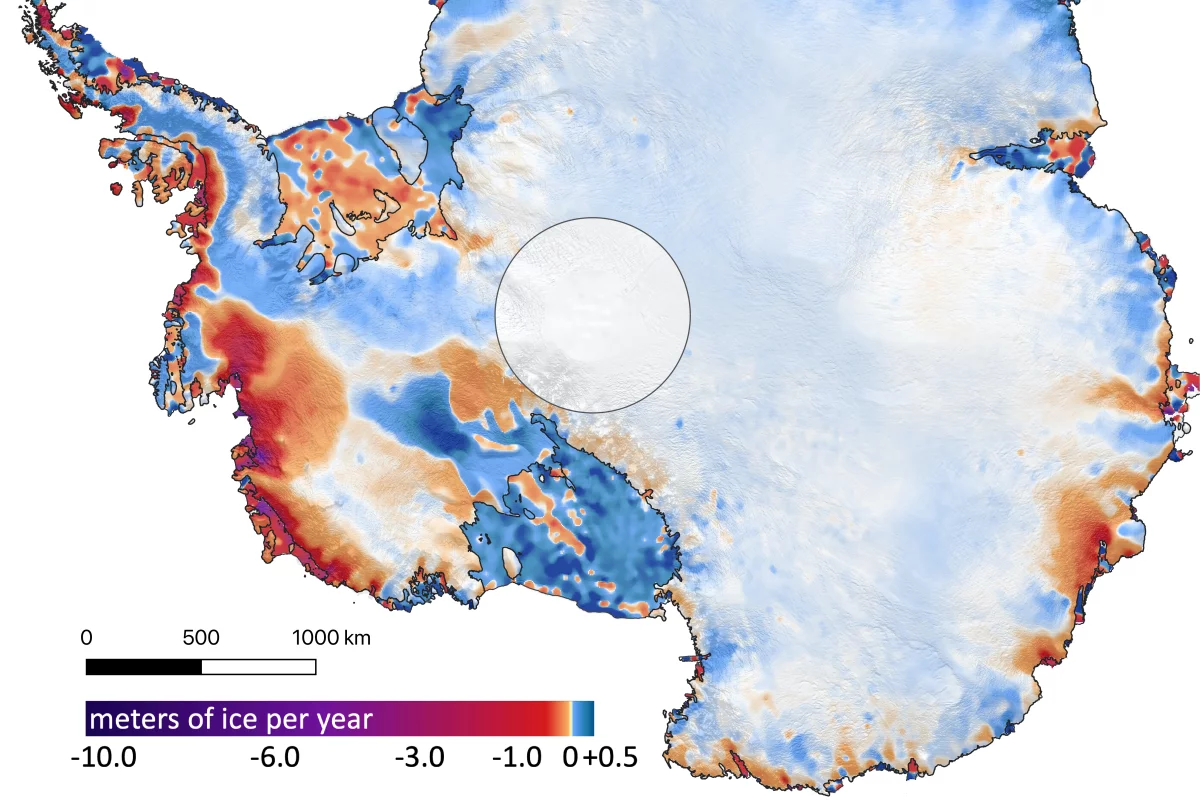
Conversely the thickness of the ice sheet in certain regions in Antarctica – mostly in the interior of the continent – was found to have increased as a result of heavy snowfall. However, this increase is dwarfed by the ice loss to the ocean.
The melting of ice shelves does not contribute to sea level rise directly, as they are already floating in the ocean and displacing water. However, they do act as a kind of stopper, slowing the flow of shelf ice into the sea. With a weaker shelf, the sheet ice will pass into the ocean at a faster rate, accelerating the speed at which the sea level is rising.
The Crosson and Thwaites ice shelves, which are located in West Antarctica and are responsible for holding back fast flowing glaciers, were found to have thinned by an average of three meters (10 ft) and five meters (16 ft) respectively year on year.
Overall, Greenland’s ice sheet is estimated to have lost on average 200 gigatons of mass per year, while Antarctica’s ice sheets melted to the tune of 118 gigatons of ice per year. According to a release from the University of Washington, a single gigaton of ice would be enough to fill 400,000 Olympic swimming pools.
The authors of the study state that the ice losses contributed to a rise in sea level of around 14 mm (0.55 inches) since 2003.
The paper has been published in the journal Science.
Source: University of Washington