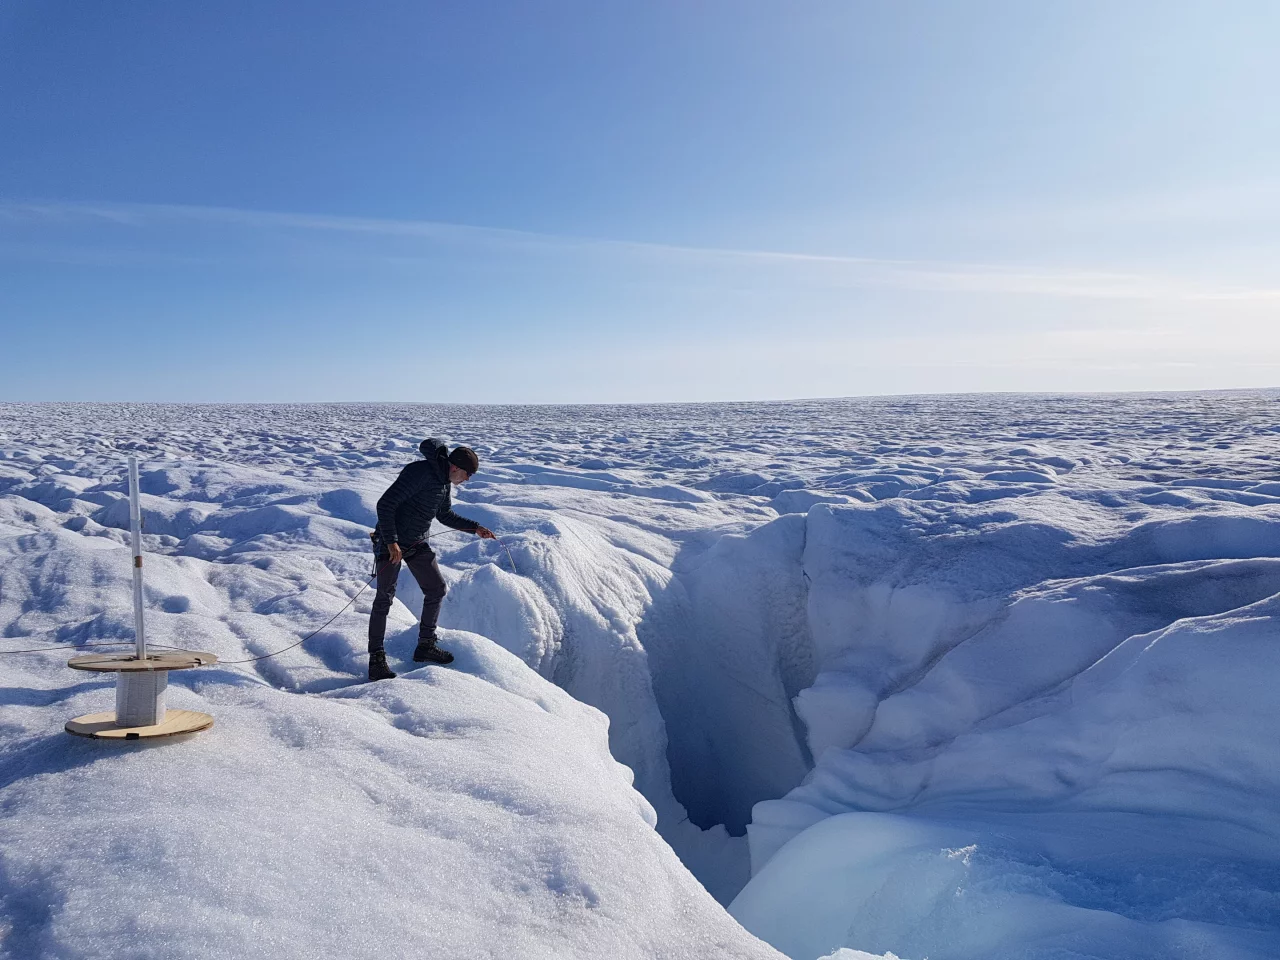
Tracking changes in huge masses of ice is key to understanding the effects of climate change on the planet, and researchers in Greenland have developed a new tool that takes the accuracy of such measurements to unprecedented levels. The technology uses a mix of fiber-optic cables and laser pulses to gain precise temperature readings from the surface of the Greenland Ice Sheet all the way down to the bottom, offering a clearer picture of the changes taking place in the world's second largest ice sheet.
The research led by scientists at the University of Cambridge sought to improve on the current state of the art when it comes to taking the temperate of ice sheets. Usually, this involves fitting sensors to a cable that is fed down a hole, offering readings of the environment beneath the surface, but from locations spaced tens or hundreds of meters apart.
"We normally take measurements within the ice sheet by attaching sensors to a cable that we lower into a drilled borehole, but the observations we've made so far weren't giving us a complete picture of what's happening," said study co-author Dr. Poul Christoffersen. "The more precise data we are able to gather, the clearer we can make that picture, which in turn will help us make more accurate predictions for the future of the ice sheet."
The new technology uses a fiber optic cable that can emit laser pulses along its entire length, stretching from the surface of the sheet to its base a kilometer below. By analyzing the varying distortions in the scattered light as it encounters the surrounding ice, the system can reveal its temperature.
"With typical sensing methods, we can only attach about a dozen sensors onto the cable, so the measurements are very spaced out," said first author Robert Law, a Ph.D. candidate at the Scott Polar Research Institute. "But by using a fiber-optic cable instead, essentially the whole cable becomes a sensor, so we can get precise measurements from the surface all the way to the base."
This new tool is already reshaping what scientists know about temperature distribution in ice sheets. It was thought that this resembled a smooth gradient, with the warmest points found at the top where sunlight strikes and also at the bottom as a result of geothermal energy and friction with the subglacial landscape.
Instead, the scientists deployed the new fiber-optic cable to find areas of highly localized hot spots at boundaries between ice of different ages and types, driven by deformations. The reasons for these deformations aren't yet known, but the researchers suspect it may be due to dust trapped in the ice or subsurface fractures.
The Greenland Ice Sheet is melting at an alarming rate, with mass loss increasing sixfold since the 1980s and now contributing more to global sea level rise than any other source. Understanding how the ice is shifting and the thermodynamic processes beneath the surface will enable scientists to more accurately model the melting process, and better prepare for the future.
"Overall, our readings paint a picture that's far more varied than what current theory and models predict," said Christoffersen. "We found temperature to be strongly influenced by the deformation of ice in bands and at the boundaries between different types of ice. And this shows there are limitations in many models, including our own."
The research was published in the journal Science Advances.
Source: University of Cambridge