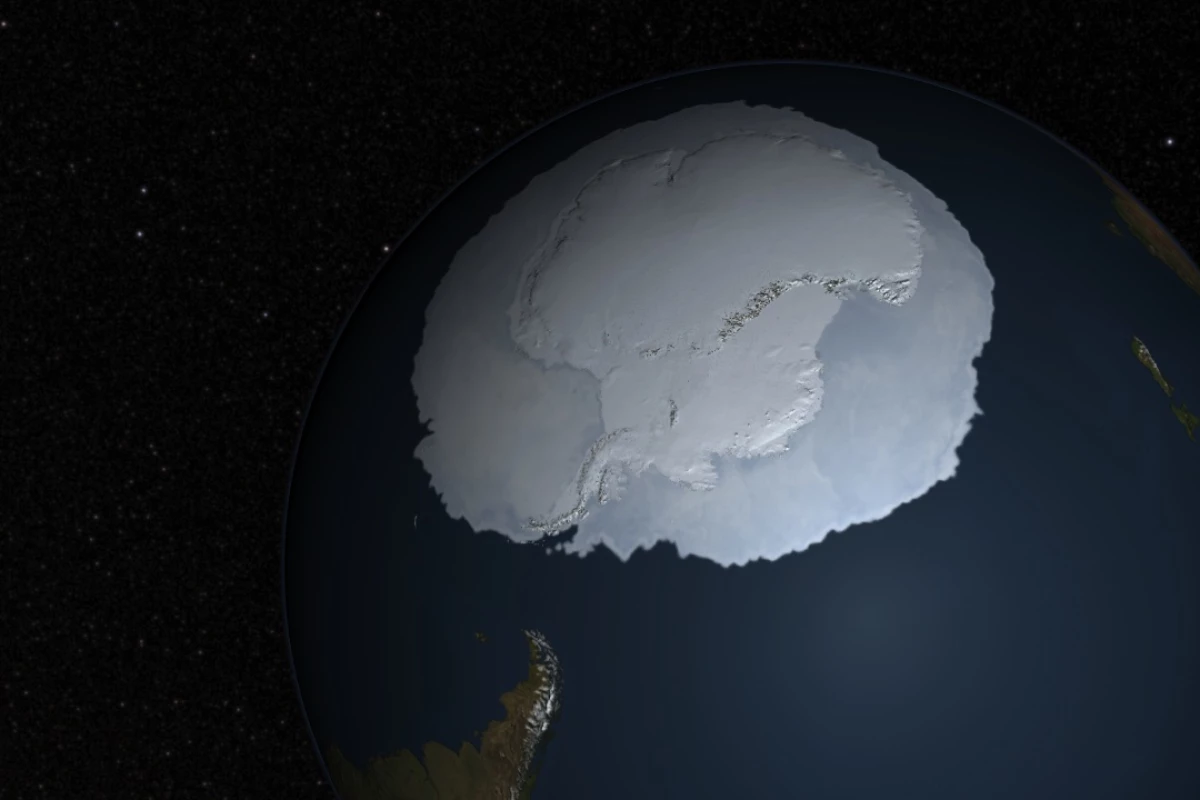
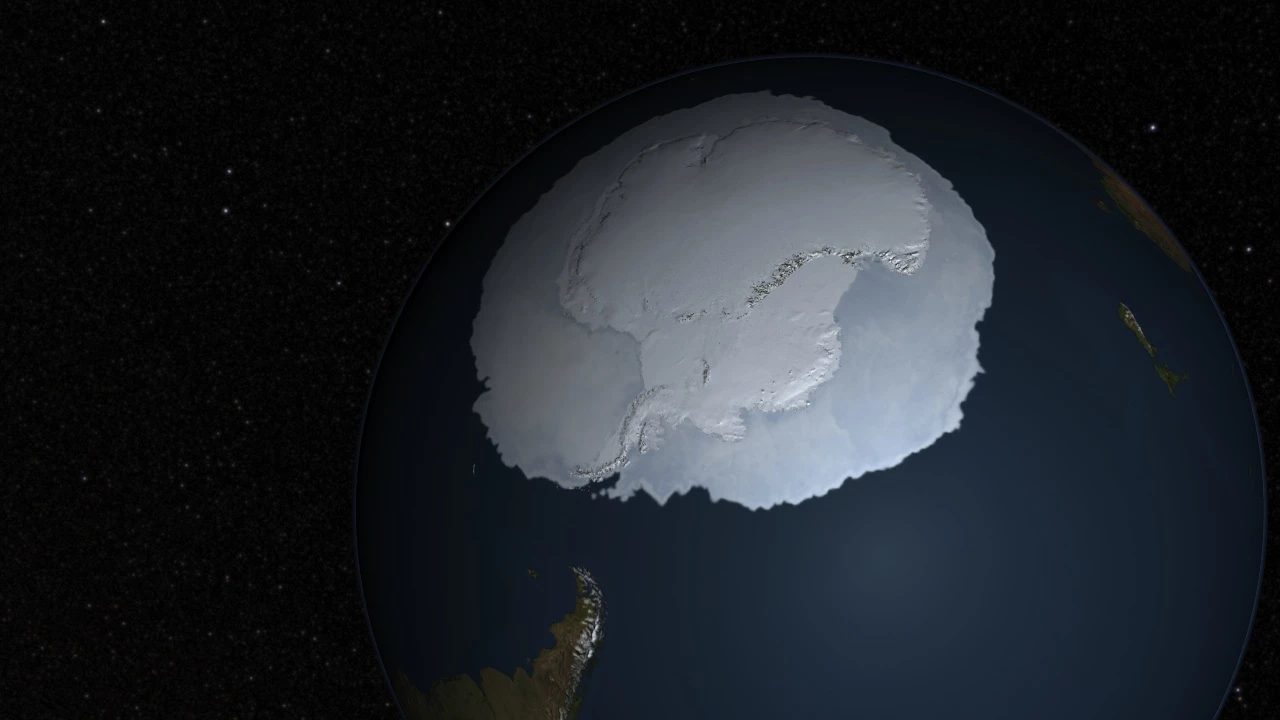
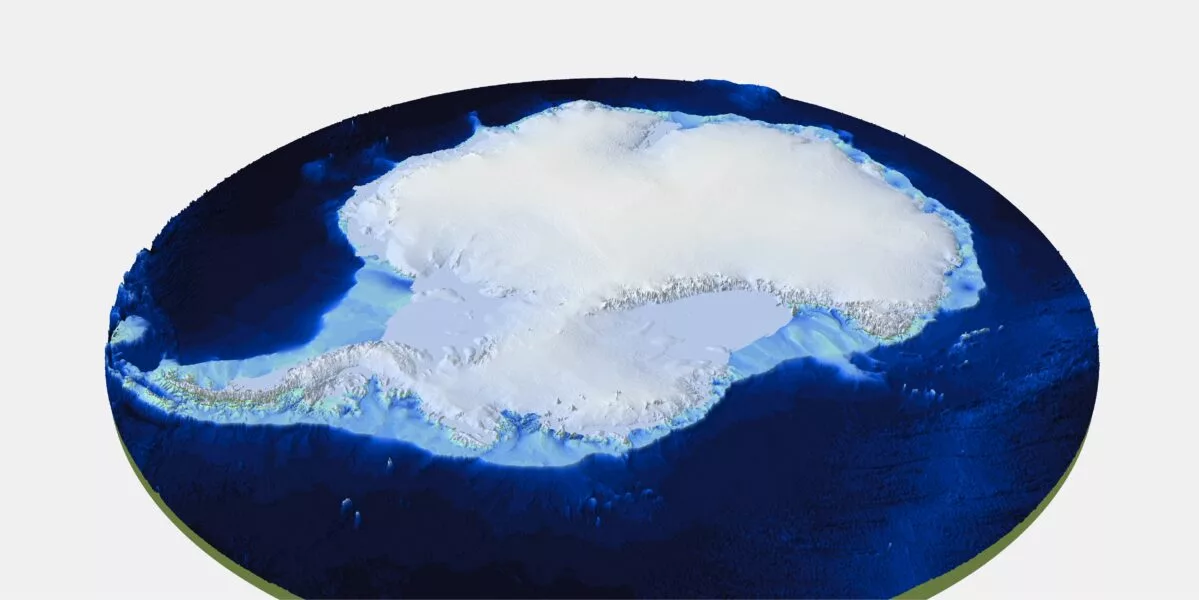
The British Antarctic Survey (BAS) has released the most detailed map yet of what Antarctica looks like when you strip away its ubiquitous cover of ice and snow. Derived from 60 years of data, it will help scientists understand ice flows better.
Antarctica is the toughest of all the continents to map because almost its entire land surface and even much of the seabed around it is sealed under a perpetual cap of ice that contains 70% of the entire world's supply of fresh water. With an average thickness of 1.2 miles (1.9 km), you need a lot more than a theodolite, a ranging rod, and a flask of coffee to map the place.
In fact, the BAS says that it had to use six decades worth of readings collected using aircraft, satellites, ships, and dog sleds (though dogs are rubbish at taking bearings) measuring radar, sonar, and gravitational anomalies, combined with sophisticated computer models to complete what is called Bedmap3.
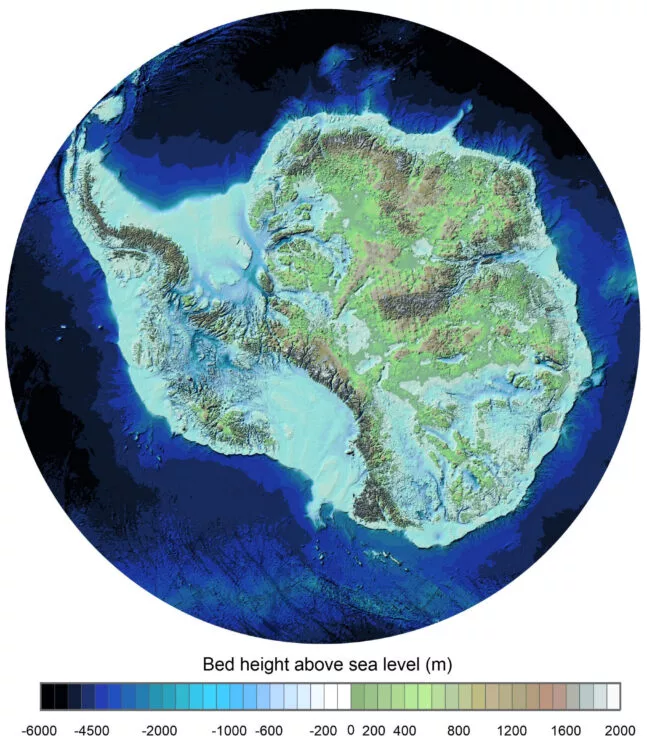
This is the third such map created by BAS and a team of international scientists since 2001. Its purpose is to peel back the 6.5-million-cubic-mile (27-million-km³) ice cap to reveal the bedrock beneath.
The result is a new, far more detailed map of the actual continent than anything previous. The findings include the highest Antarctic mountains and deepest canyons, as well as points where the ice plunges to depths of up to 15,607 ft (4,757 m).
According to BAS, the purpose of this is more than just cartographical completeness. It also shines a powerful light on the mechanics of Antarctica – especially how the glaciers flow over its surface and how subsurface warm water rivers affect the ice, which could have global consequences.
"This is the fundamental information that underpins the computer models we use to investigate how the ice will flow across the continent as temperatures rise," said Dr. Hamish Pritchard, a glaciologist at BAS and lead author on the study. "Imagine pouring syrup over a rock cake – all the lumps, all the bumps, will determine where the syrup goes and how fast. And so it is with Antarctica: some ridges will hold up the flowing ice; the hollows and smooth bits are where that ice could accelerate."
One curious point about this bedrock map is that its accuracy depends on the ice being present. If you take it away, it all changes. For one thing, the water from the ice would have to go somewhere, which would cause global sea levels to rise 190 ft (58 m).
Even odder, the ice cap weighs a staggering 24.759 quadrillion tonnes. Take that away and the entire continent would rebound like a spring, pushing it out of the ocean in the same way Europe, North America, and Asia have been rising for about 12,000 years since the end of the last ice age.
This is why terms like mean sea level aren't as simple as they first appear and tend to really annoy oceanographers and geodesists.
The research was published in Scientific Data.
Source: BAS