Environment

This 50,000-year-old block of ice reveals the true state of CO2 levels now

This 50,000-year-old block of ice reveals the true state of CO2 levels now
This ancient ice block is helping tell the true story of global warming
View 1 Image
This ancient ice block is helping tell the true story of global warming
1/1
This ancient ice block is helping tell the true story of global warming

Despite an ever-growing body of evidence indicating we're now living beneath unprecedented levels of atmospheric greenhouse gases, a lack of thorough historical knowledge has hindered our ability to put present-day CO2 emissions into a concrete, long-term context. So what if we're able to use the planet's own record-keeping to fill in those important blanks?

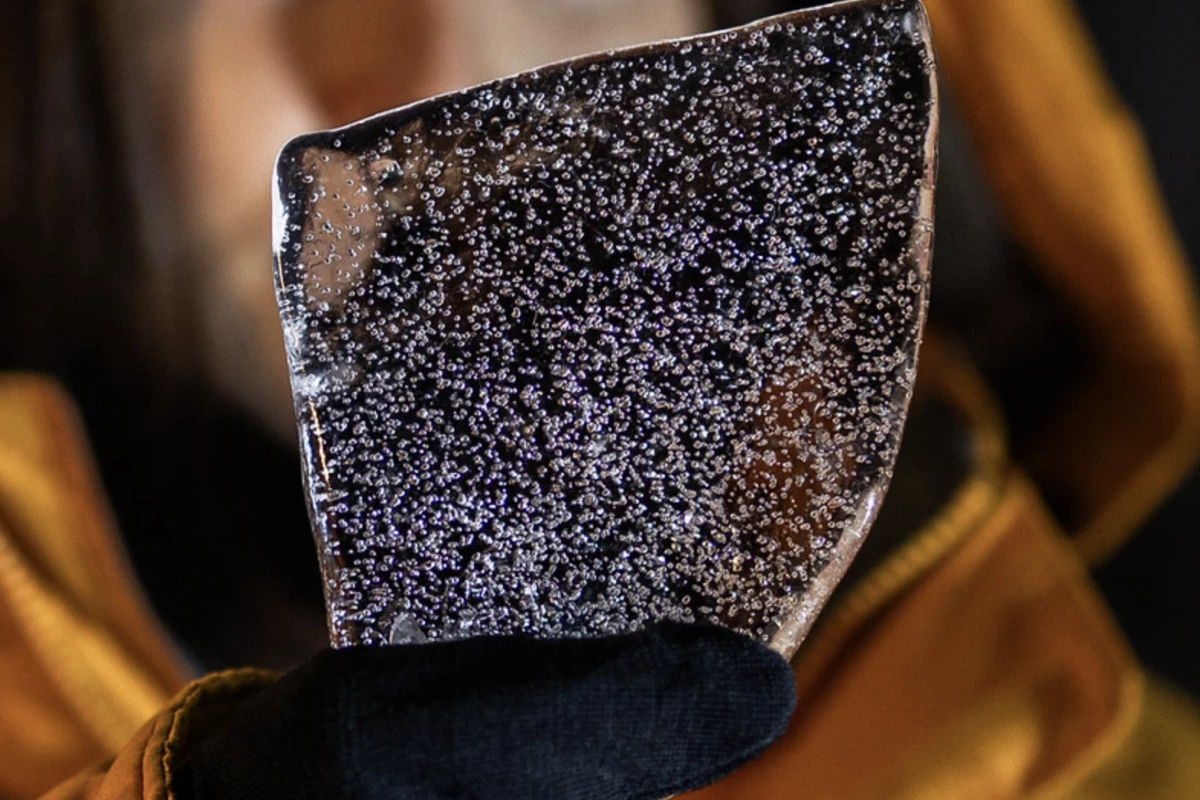
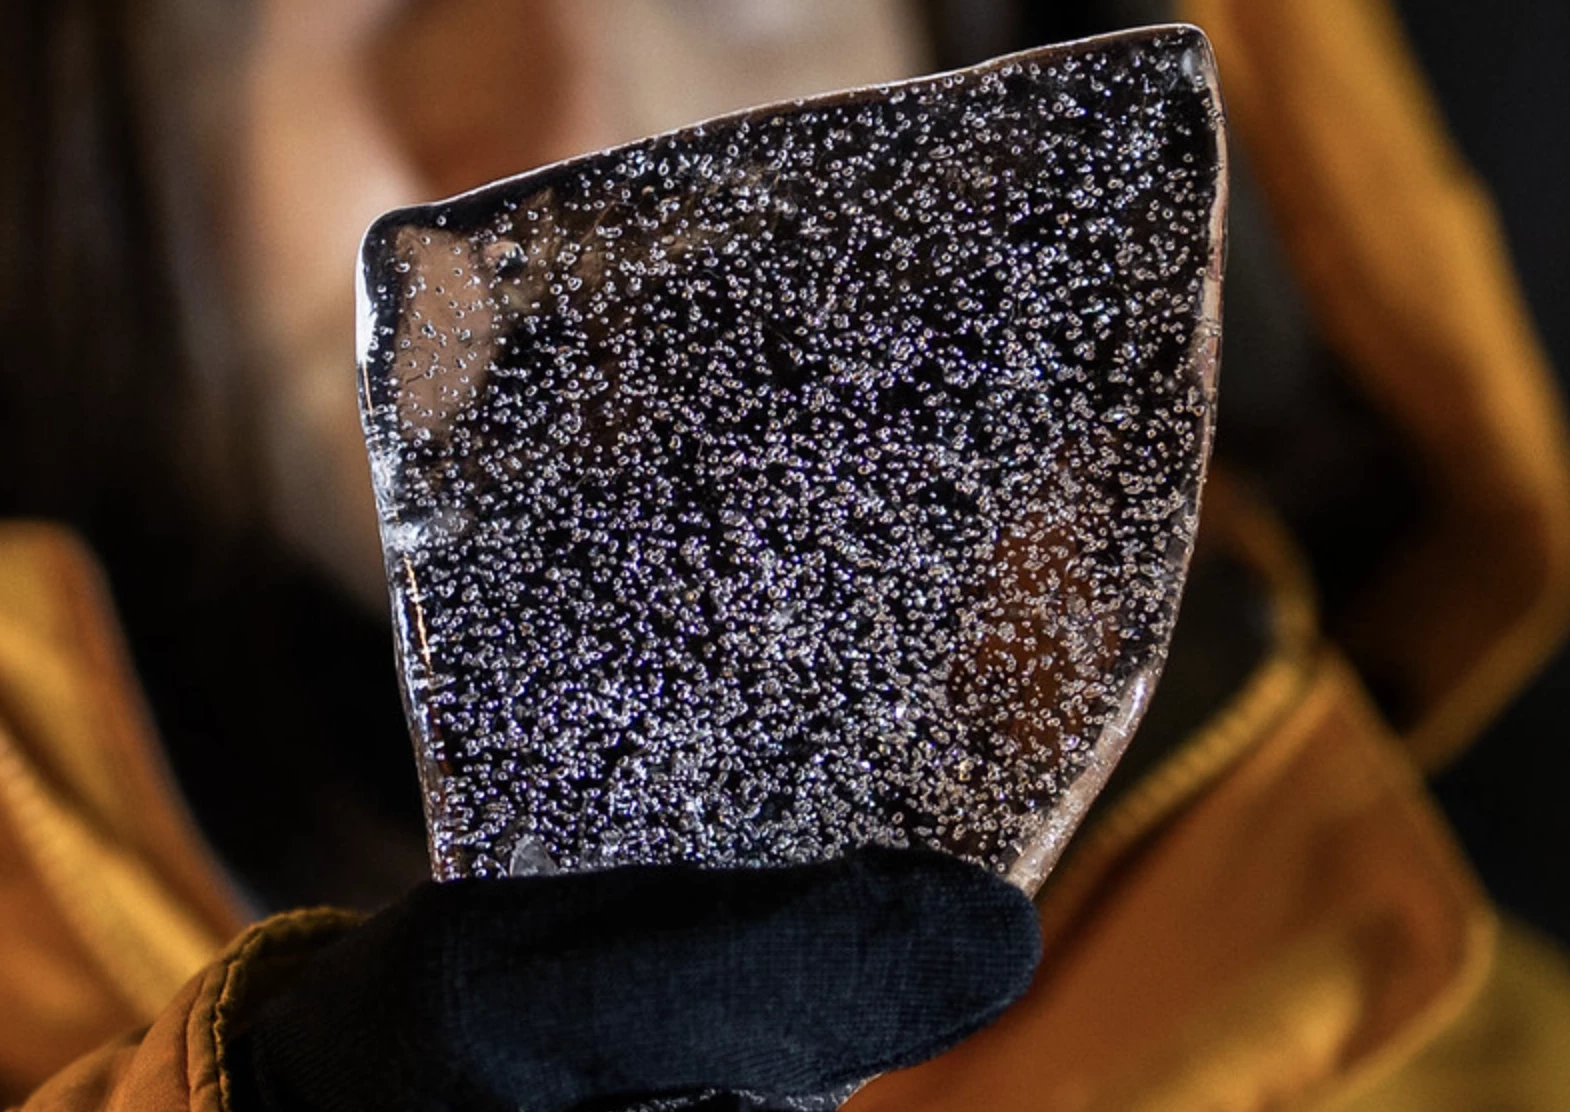
This is the bold approach taken in a new study from Oregon State University (OSU) and University of St Andrews scientists, who, working with the US National Science Foundation, have unlocked a 50,000-year timeline of atmospheric carbon dioxide – thanks to tiny bubbles trapped in Antarctic ice, frozen in time miles below the Earth's surface.

“Studying the past teaches us how today is different," said Kathleen Wendt, an assistant professor at OSU and the study’s lead author. "The rate of CO2 change today really is unprecedented."

Using frozen samples from the West Antarctic Ice Sheet (WAIS) Divide ice core, which were extracted by drilling two miles (3.2 km) deep, the team conducted chemical analysis on the little pockets of preserved gases in the ice blocks to get a clear picture of atmospheric CO2 changes over the many, many years.

What the researchers found was that yes, there have been periods of elevated CO2 in the atmosphere far beyond 'normal' range – but those levels pale in comparison to what we're now facing thanks to anthropogenic greenhouse-gas emissions.

While the team identified that, over 50,000 years, the natural ebb and flow of CO2 in the atmosphere did increase by an estimated 14 parts per million across 55 years, every 7,000 years or so. Now, CO2 levels jump that same amount every five to six years.

Essentially, CO2 levels are now increasing at a rate that's 10 times faster than at any point in the last 50,000 years.

“Our research identified the fastest rates of past natural CO2 rise ever observed, and the rate occurring today, largely driven by human emissions, is 10 times higher," Wendt said.

The team's analysis has painted a clear, long-term picture of the Earth's historic atmospheric CO2 fluctuations, which also revealed spikes coinciding with North Atlantic cold intervals – or Heinrich events – that are linked to sudden and significant climate changes.

“These Heinrich events are truly remarkable,” said Christo Buizert, an associate professor at OSU and co-author of the study. “We think they are caused by a dramatic collapse of the North American ice sheet. This sets into motion a chain reaction that involves changes to the tropical monsoons, the Southern Hemisphere westerly winds and these large burps of CO2 coming out of the oceans.”

Existing climate data has forecast these westerly winds to likely become stronger and more frequent as the planet warms, and if so will reduce the all-important Southern Ocean's ability to absorb and contain human-generated CO2. Safe to say, this is not the kind of positive feedback loop that scientists want to see, as the planet continues to warm.

“We rely on the Southern Ocean to take up part of the carbon dioxide we emit, but rapidly increasing southerly winds weaken its ability to do so,” added Wendt, who believes the historical knowledge will ultimately enable a better understanding of Earth's processes and increase our ability to better target interventions.

"The rate and magnitude of atmospheric CO2 rises resolved in this study provide critical constraints on carbon-cycle variability during abrupt climate shifts and urge caution that the modern-day Southern Ocean carbon sink has the potential to weaken in response to continued poleward enhancement of the SH westerlies," the researchers concluded.

The study was published in the journal Proceedings of the National Academy of Sciences.

Source: Oregon State University

21 comments
21 comments
David F
50,000 years is not long enough to study variations in Earth's climate, or whether there's a relationship between trace gases and climate.
minivini
@David F - it is, however, a long enough period of time to deduce that atmospheric CO2 levels have not been this high since humans evolved enough to impact them. We were around prior to that point, but without the numbers or technology to create such an abundance of atmospheric gases that cause solar heat trapping.
dave be
within that 50,000 years we've seen shifts in the climate several times. Its plenty of time, and plenty of cycles to determine that theres the relationships that every other scientific study has revealed there to be.
Arandor
@minivini - But that doesn't guarantee humans did have an impact on them. What if there's a trend over, for example, a quarter of a million to a million years where CO2 does spike this high without human contribution? This new data is helpful but not definitive.

On a different note, it's interesting that climate change and going green is such a major focus for so many industries, but there's one industry that's going in the opposite direction. Fashion. Carbon-expensive synthetic fibers have essentially taken over. It used to be that all men's pants were 100% cotton. Now it's hard to find 100% cotton. The same trend goes in women's clothing. Today, cotton only accounts for 27% of the textile market, down from 85% 100 years ago.

It started with a bad cotton harvest in the late 2000s and manufacturers began adding synthetics to cut costs. When cotton prices went back to normal, they realized they could keep cutting costs with synthetic fabrics and pocket more profit. They tell people, "This is what consumers wanted," yet it was forced upon consumers.

So we focus heavily on climate change and going green with construction, energy, food, etc., but the clothes we wear every day get a pass so the fashion industry can pocket more profit.
vince
Hopefully mankind will drive up the CO2 to about 1000 ppm and then all of the ice caps will melt. Look at all that new real estate to buy/sell and harness for crops, etc. Of course, will lose a lot more real estate in the present day continents as the 220 foot rise inundates most of the world. Did you know that for every 1 foot rise in the sea level that will lose over 25 million acres globally and that if waters rose 239 feet for the maximum melt and sea expansion from heat that we would lose over 4 billion acres? Fortunately we would gain almost the same acreage in the new iceless Greenland and Antarctica. But not much will grow in Anarctica due to the lack of sun and cold. ditto for Greenland.
c2cam
What am I overlooking here? They are getting a 50,000Y timeline from a 50,000YO ice sample. I would think that would just be a 50,000YO snapshot of what the atmosphere was like at that time. How are they gleaning a timeline past to present on a single sample? The article does state "unlocked a 50,000-year timeline of atmospheric carbon dioxide". Just asking a novice question.
fredricwilliams
The one thing that should cause us to be more cautious about data purporting to show the immense disaster that is certain to occur from rising temperatures is the constant flow of data that is of questionable value. Here we take data from the depths of the most recent period of global glaciation -- a time when CO2 levels are known to be extremely low -- as if that were relevant to the past 150 years. It is not. What is ignored here -- and nearly everywhere -- is that CO2 levels have been many times higher -- up to nearly 15 times current levels -- during periods of increasing biological abundance and diversity. The real test of whether warming temperatures are "catastrophic" is a look at the effect of temperatures on humanity over 150 years of increasing prosperity and health,
Dr. Saul Pressman
The fact that we have maps showing an ice-free Antarctica means that any dating attached to these samples is of no veracity.
We saw with the discovery of the P-38 Lightning under the ice of Greenland, that 1 mile of ice can build up in just 1000 years.
This is bogus science.
Christian
again, the most biologically active/prolific/abundant periods of earth's history occurred when there were NO ICE CAPS, so...no record in ice is possible from those times.
SussexWolf
@ c2cam It’s an ice core sample which starts now and goes back 50,000 years. It’s not a single layer from 50,000 years ago.
Load More