Do you live in a lightning hotspot? A new set of maps shows just where all that discharged electricity makes contact with the ground across the United States each year. Tip: If you're worried about getting hit, you might want to skip Florida.
That's because, according to the maps, Florida is the United States' hotspot for lightning strikes. In fact, the Miami-Fort Lauderdale area alone had more than 120,000 lightning strokes (not a typo, see below) in 2023.
The maps were created by Chris Vagasky, a meteorologist from the University of Wisconsin-Madison, along with a team of scientists from other universities and meteorological institutions.
To create them, the team relied upon data from the National Lightning Detection Network (NLDN), a series of antennae placed around the country that relies on the radio waves produced by lightning strikes to track their prevalence. The system can detect at least 97% of cloud-to-ground lightning strikes in the country and can distinguish between those strikes and flashes contained inside clouds.
To understand Vagasky's maps, it's helpful to know a little about how lightning is classified.
"Imagine looking out a window at a thunderstorm with cloud-to-ground lightning nearby. The lightning appears to flicker," he wrote in a piece about the research featured in The Conversation. "A lightning flash is all the cloud-to-ground lightning that occurs within one second and a six-mile radius. Each flicker is a lightning stroke. Each stroke can hit one or more ground strike points, and there can be multiple strokes in the same channel."
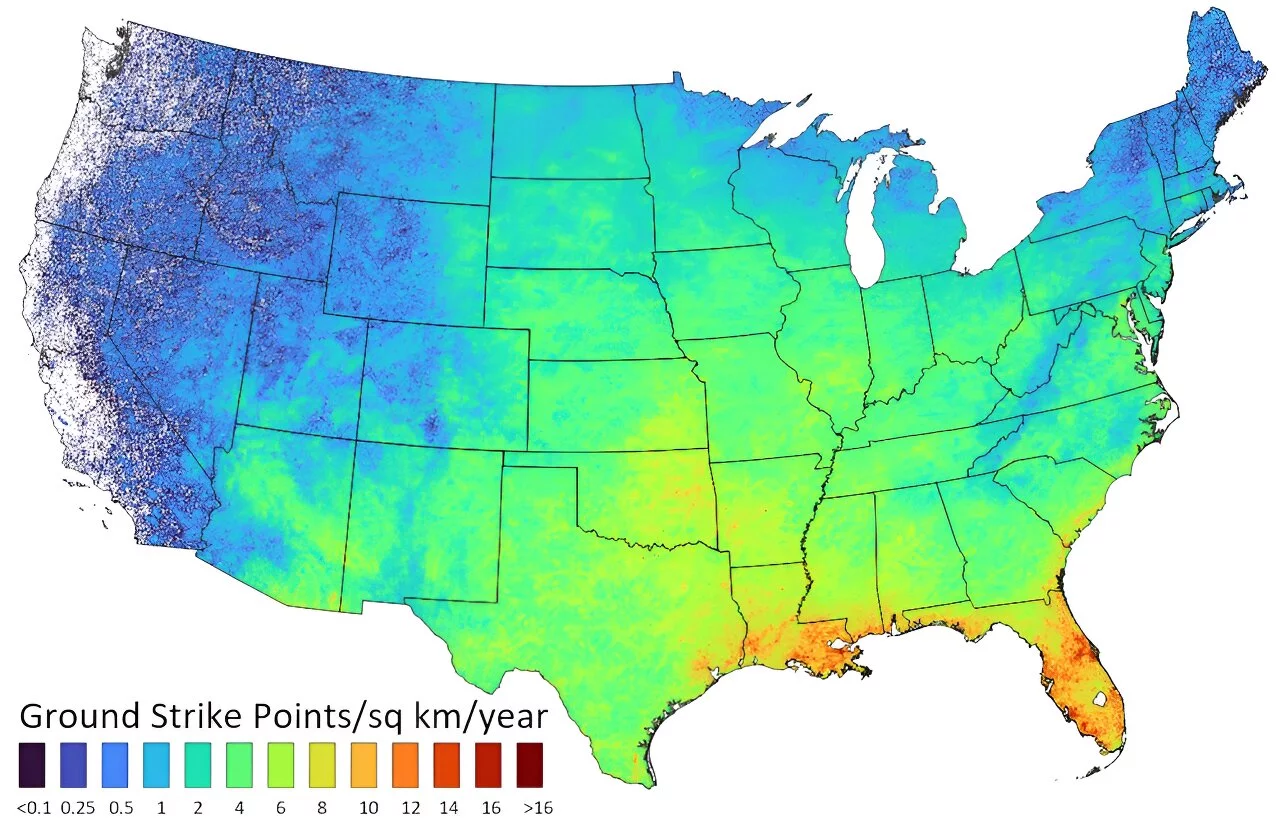
With that in mind, the first of Vagasky's maps shows how lightning ground strike points were distributed on a square-kilometer basis across the US over the course of a six-year period. There's clearly a higher distribution around the Gulf of Mexico.
"The basic ingredients for thunderstorms are warm and moist air near the ground with cooler, drier air above it and a way to lift the warm moist air," Vagasky wrote. "Anywhere those ingredients are present, lightning can occur. This happens most frequently near the Gulf Coast, where the sea breeze helps trigger thunderstorms most days in the summer."
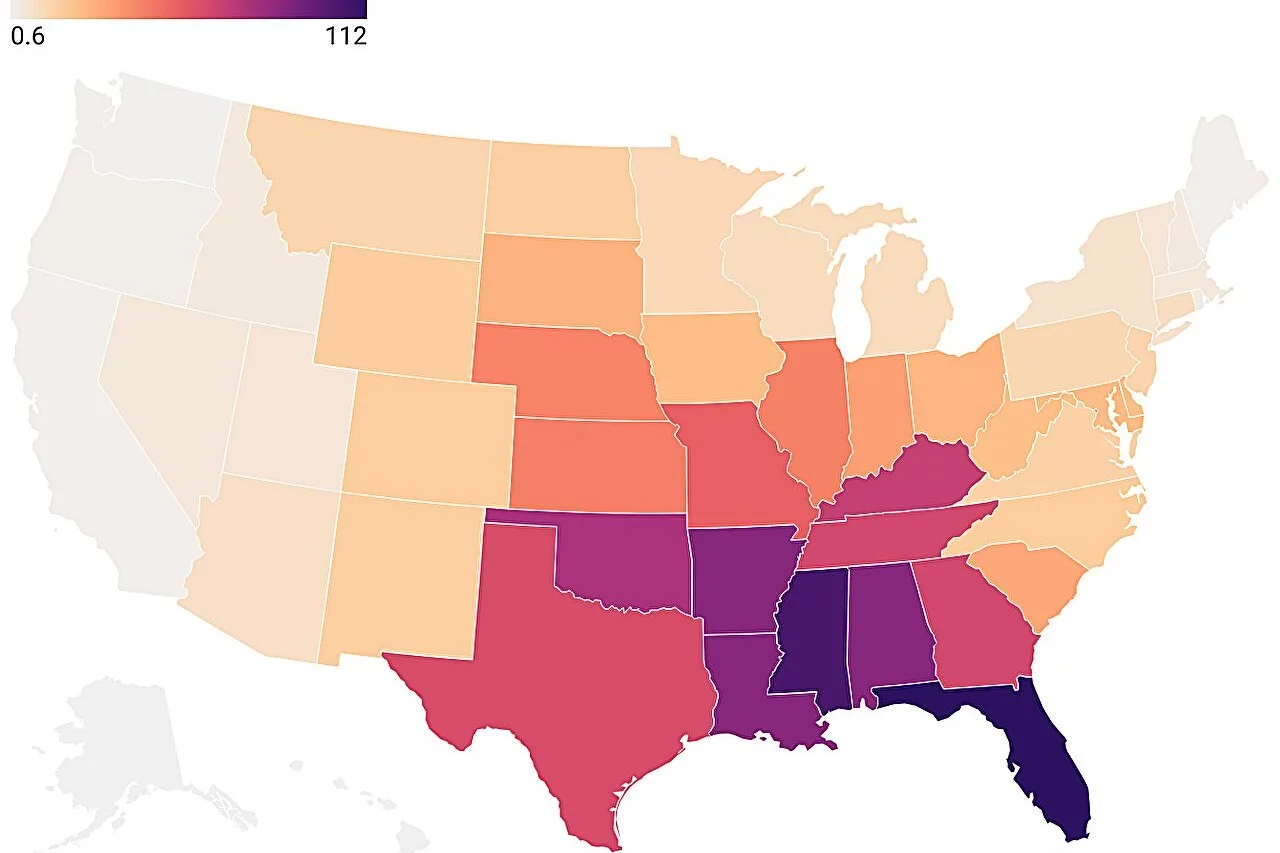
The next map highlights the density of lightning strikes across the country, and here's where you can really see just how charged Florida – and nearby Mississippi – are. Even though Texas had more overall lightning strikes in 2023, these two other states had strikes in a more compressed area. The scale at the top of the image represents strikes per square kilometer increasing from left to right.
The final map from Vagasky and his team shows the number of ground strike points per each flash averaged over a period of five years, and again highlights the lightning-rich nature of the Gulf.

Vagasky says there's not yet enough to data to tell if lightning strikes have been increasing or decreasing in frequency yet, but feels that the maps can provide valuable data to a range of services.
"Meteorologists and emergency management teams can use this new data and our analysis to better understand how lightning typically affects their regions," he said. "That can help them better forecast risks and prepare the public for thunderstorm hazards. Engineers are also using these results to create better lightning protection standards to keep people and property safe."
The research has been published in an article entitled, "How Much Lightning Actually Strikes the United States?" in the Bulletin of the American Meteorological Society.