

A team of researchers from Stanford University has developed an interactive website that allows users to create their own custom model estimating how different social distancing interventions affect the spread of COVID-19 over time. The primary goal of the website is to highlight how the length of a first social lockdown, and the specific measures that follow, influence the degree of a viral resurgence later in the year.
“Our models explore interventions that change over time,” explains Erin Mordecai, a Stanford biologist working on the project. “For example: What happens if we wait one week longer before issuing a shelter in place order? How long do we expect a given percent reduction in social contacts to need to be sustained before we start to see a decline in cases? How can we use adaptive strategies that actively turn off and on interventions as we track the number of hospitalized cases?”
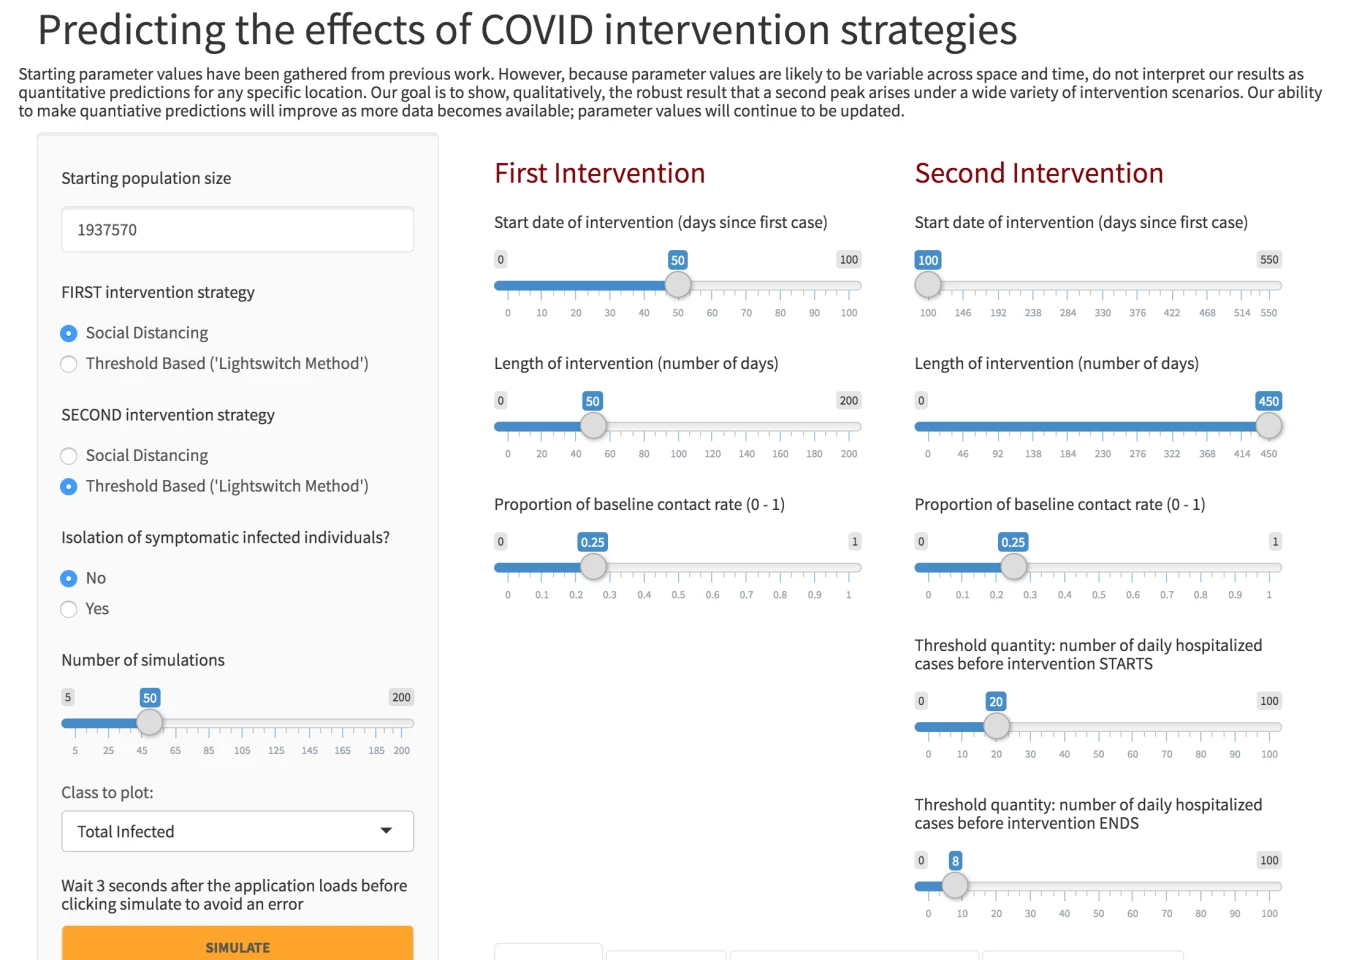
The interactive model presented by the researchers is not designed to present specific location-based predictions, but instead offers general results based on a staged intervention strategy. Users can input their own data, plotting the start dates for two interventions and overall lengths of social distancing periods. The model offers linear and logarithmic scale outputs, plotting everything from the total number of people infected and hospitalized, to total recoveries or fatalities.
One of the big takeaways from the model is how dangerous a second wave of the disease could be if initial social distancing measures are lifted without active measures being put in place. Mordecai uses a light-switch analogy to describe how social distancing measures may have to be switched on and off to keep the local community spread of COVID-19 at a level that doesn’t overwhelm local hospitals.
“We don’t need to be totally locked down for a year or more,” Mordecai says. “Adaptive strategies that actively turn on and off interventions – like a light-switch – can allow for periods of greater mobility while still keeping the epidemic at levels our healthcare system can manage. Improved testing capacity will allow us to use more targeted approaches to identify and isolate infected people and their social contacts.”
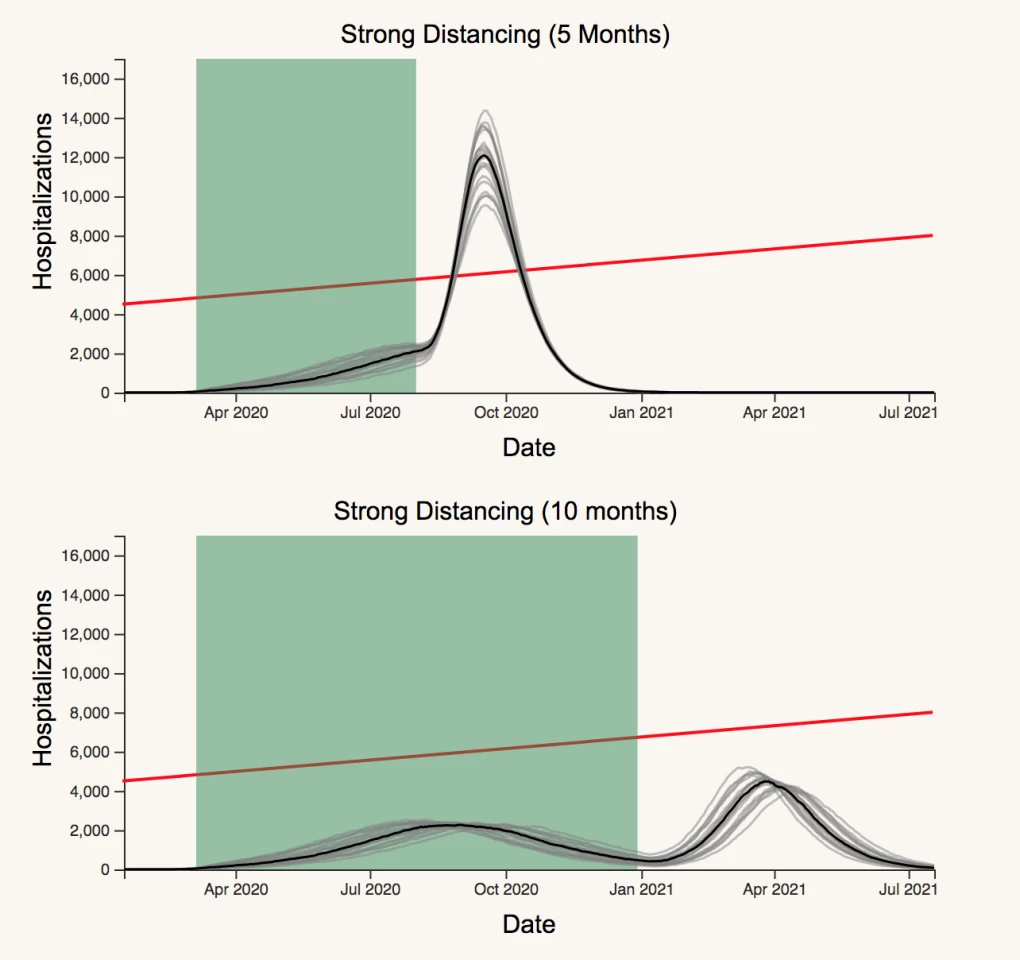
The above image is a model showing how a single strong bout of social distancing will effectively flatten the curve, as long as everyone remains isolating. However, as soon as those measures are relaxed the spread will peak above levels manageable by health care systems. Only the unrealistic proposition of at least 10 straight months of strong social distancing could prevent a dangerous second peak.
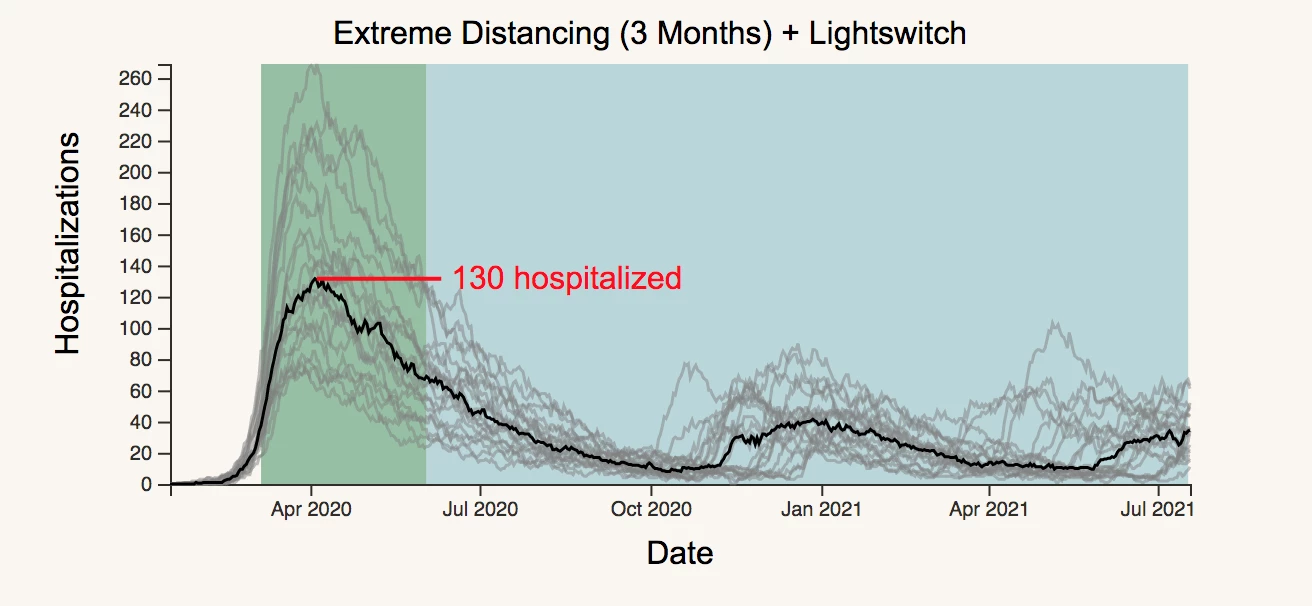
The model of the light-switch method (seen below) offers an indication of how, following a strong first wave of social distancing, the spread of COVID-19 may be kept under control. Certain local hospitalization thresholds can act as triggers to restart social distancing practices.
Mordecai suggests this interactive website will be updated over time as new data offers greater predictive modeling. As countries such as China and South Korea begin to lift initial lockdown measures it will become clearer what subsequent mitigation strategies will be necessary to avoid a second transmission peak.
“At a minimum, we plan to update parameters as more data become available and other scientists continue to make better estimates,” says Mordecai. “We will update our baseline intervention scenarios to reflect those that are actually implemented, and may expand the interventions we consider if new plans are proposed. Ideally, we would eventually be able to fit our model to infection dynamics in specific locations so that user-chosen scenarios better reflect the future of COVID-19 in those areas.”
Take a look at the interactive model, and plot your own scenarios here.
Source: Stanford University